|
Step 6:
Using different Reports
Reports are predefined formats and designed only for printing
or for viewing in the Print Preview window. You cannot enter
data directly into a report. Project includes several predefined
task, resource and assignment reports you can edit to get the information
you want.
In this exercise you will explore various reports in order to investigate
project related information.
Exercise:
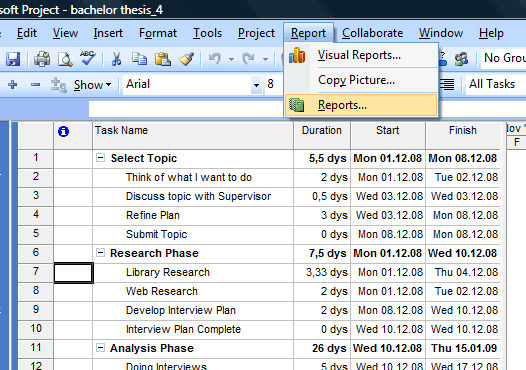
- Open your project plan in the Gantt Chart view.
- On the Report menu in the main menu bar, click Reports.
- The Reports dialog box appears, showing the
six broad categories of reports available in Project. Your
screen should look similar to the following illustration:
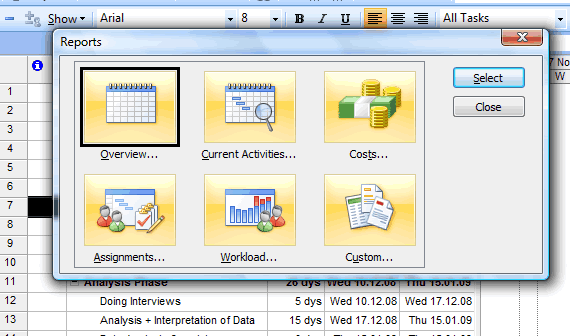
- Double-click on Overview and then on Project
Summary.
Project displays the project Summary report. This is a handy summary
of the project plan's tasks, resources, costs and current status.
You could use this report, for example, as a recurring status
report that you share with the client or other stakeholders of
the project.
- In the Overview category, double-click on Top-Level
Tasks to find out e.g. how much work each project phase requires.
What is the work for phase 3 in our project - the analysis
phase? Make a note of the work and email me the figure
after the completion of the tutorial.
- Double-click on Costs in the Reports dialog box
and then double-click on Budget to get a budget break down
for each task of the project. What are the Total Cost for the
task 'Doing Interviews'? Email me the figure after
the completion of this tutorial.
- Double-click on Assignments and then on Who Does What
When to get a detailed breakdown for each resource when a
task is due.
You have now completed Step 6 and can move on to the final step
of this tutorial.
|